

Key Takeaways:
- An audiogram shows the softest sounds (volume: soft to loud) you hear at each frequency (low to high pitches).
- The lower the line on the graph, the worse your hearing is at that frequency.
- If the audiogram dips lowest on the left, it means low-frequency hearing loss. If it dips on the right side of the graph, it means high-frequency hearing loss.
- There are several different common hearing loss patterns (see below): sloping, notched, reverse sloping, cookie bite, unilateral, and asymmetric.
.png)
If you have trouble hearing, the best thing to do is see an audiologist for a comprehensive hearing evaluation.
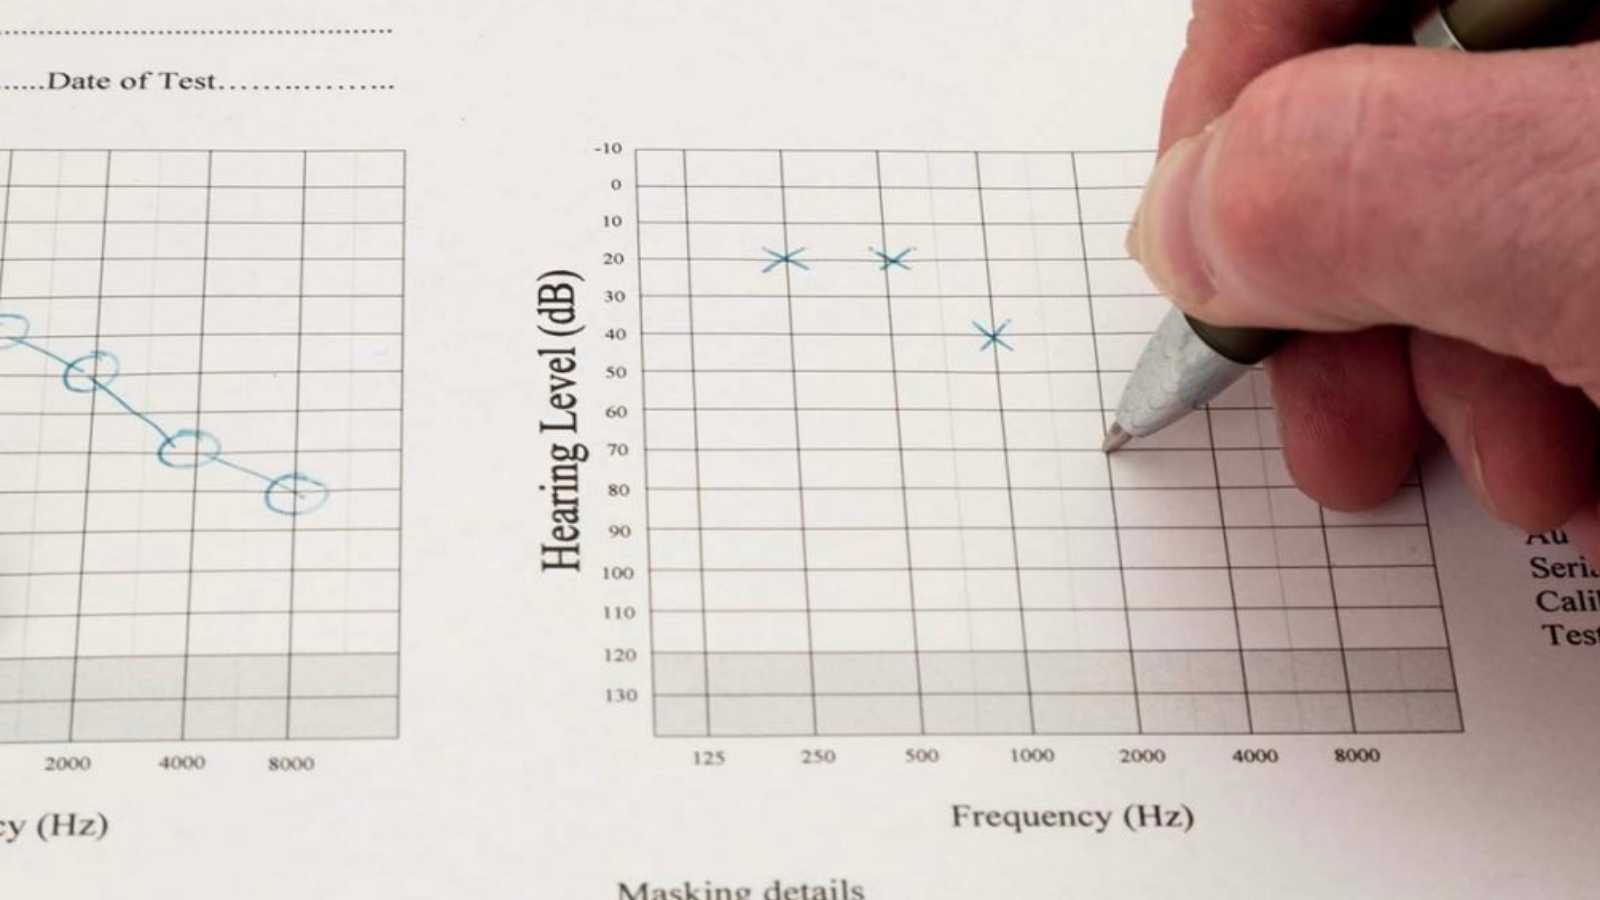
A hearing test also called an audiogram, gives an overall picture of your hearing at specific frequencies or pitches. Results will look something like this:

If you aren't sure what you are looking at, don't fret. In this guide, we'll go over how to read an audiogram and share some typical results and what they mean.
You can take an online version of a hearing test for free here. This online screener won't replace a full audiologist workup but it's a great place to start.
Prefer to watch?
Click below for a short video from Dr. Amy on how to read a hearing test.
Let's start with some background on how hearing tests work.
You might be wondering how hearing is measured. How is it possible to tell how well a person can hear?
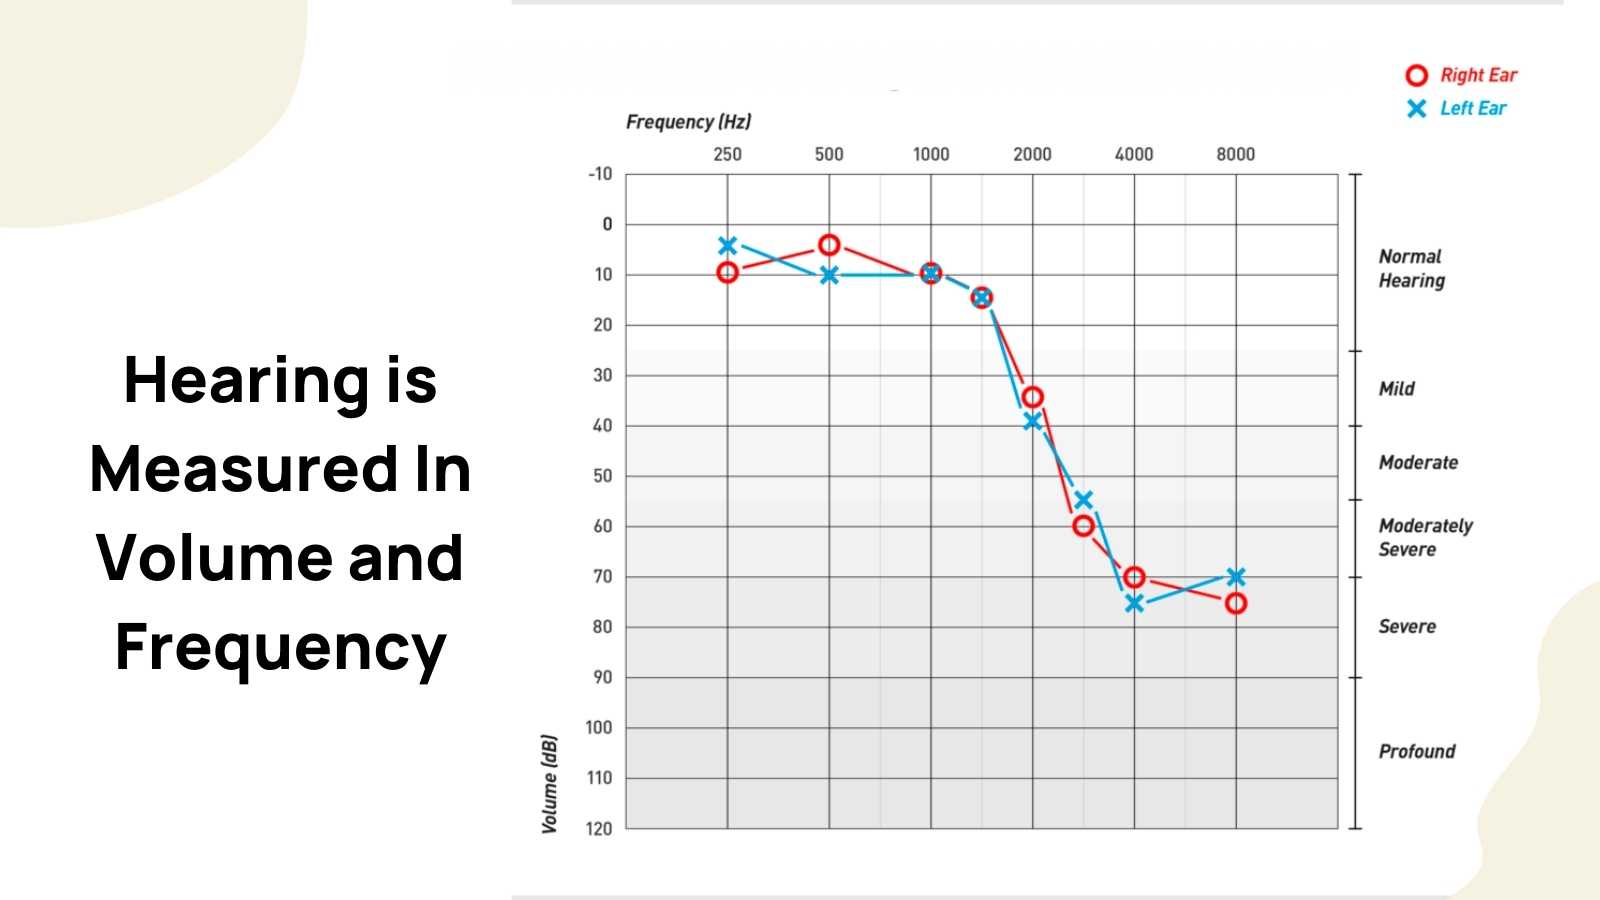
An audiogram measures two things: loudness and frequency. Let's look at some brief background.
First, let's talk about loudness or volume. Sound is measured in decibels. To be specific, it is detected in sound pressure level (dB SPL), which is an objective measurement of how loud a sound is.
What is considered normal hearing?
Loudness
Scientists use research to give us a range of what we define as "normal" hearing.
By sampling a group of young people, they could quantify the softest sounds a person with normal hearing can detect about 50% of the time.
On an audiogram, "normal" comes in at 0 - 20 dB HL at each frequency tested.
Pitch
Sounds are measured not only in loudness but also in pitch or frequency. Pitch is measured in a unit called hertz (Hz), or cycles per second.
A sound at 4000 Hz will have a higher pitch than a sound at 250 Hz. Not sure what different pitches sound like? Examples of low-pitched sounds include: a tuba, a thunder rumble, or the notes on the left side of the piano.
A good example of a person with a low-pitched voice? Just think of a Barry White song. High-pitched sounds can include things like: a flute, a young child's voice, or an opera singer hitting a high note.
Something that can be tricky to wrap your head around is that every sound has both a different pitch and volume. For example, a young child whispering is both high-pitched and low-volume. A train whistle is high pitched and also high volume.
Why is all of this important to understanding an audiogram? For speech understanding, different speech sounds have different pitches or volumes as well.
Consonant sounds (words with TSBGHXJK etc.) are more high-pitched and low in volume, and vowel sounds (words with EAOUI) are low-pitched and low to medium volume. It will be much easier to understand conversation if you hear both the vowels and consonants of words.
Hidden Hearing Loss
It is important to note that someone with a normal audiogram can still have hearing difficulty in some situations.
For example, someone with normal hearing may find it difficult to understand in the presence of background noise or other challenging listening situations.
Or if someone is speaking from another room, it will still be difficult to hear the person, even with normal hearing.
Research is underway on "hidden hearing loss" - a type of hearing loss when someone has a normal audiogram but a lot of difficulty in background noise. Additionally, someone with auditory processing disorder can have a normal-looking audiogram but struggle to understand speech.
What Is Included In an Audiogram?
An audiogram is a graph of your hearing, showing the softest sounds you can hear at each pitch or frequency.
An audiogram is also ear specific and even shows how well you hear from different parts of the ear or auditory pathway.
Additionally, part of the hearing test administered in the clinic also looks at how well you understand speech. This is another critical piece of information that is particularly useful for anyone considering hearing aids.
The degree of hearing loss does not always mean that speech clarity is affected to the same degree as the level of hearing loss. For example, someone with moderate hearing loss may still have good speech understanding, while another person with the same level of hearing loss may struggle to understand words clearly. Like each hearing profile, each person's brain handles sound information differently.
How to Read It
The short answer:
The lower the line dips on the chart the worse your hearing is at that frequency. Dips on the left mean you are missing low frequency sounds and dips on the right mean you are missing high-frequency sounds.
The slightly longer answer:
The audiogram classifies your hearing within categories of normal (-10 - 20), mild (25 - 40), moderate (40 - 55), moderately severe (55 - 70), severe (70 - 90), and profound (90 - 110).
Headphones or inserted earphones are used to measure air conduction results. The right ear is displayed on the graph with O symbols, and the left ear is shown on the graph with X symbols.
Other symbols you'll see on the graph look like brackets, and those show what the inner ear hears through bone conduction. Bone conduction results are measured with a special headband.
If there is a difference of more than 10 dB HL between the X or O and the bracket, that means there is something preventing the sound from getting to the inner ear. For example, fluid in the ear, bony growth in the middle ear (otosclerosis), or other reasons. This is called conductive (or mixed) hearing loss. Read more about types of hearing loss.
Common Hearing Loss Shapes
Hearing loss does not always occur at all pitches on the audiogram. Your results will be unique to you and will vary depending on various factors. If you take a test in a clinic, your audiologist will go over your test results at the end and explain your unique hearing results. Let's look at some hearing loss shapes that could show up on an audiogram.
#1. Sloping Hearing Loss Audiogram

Some people have more hearing loss in the high frequencies, usually due to age or noise exposure. In this case, the person hears better at lower frequencies than at higher ones. This configuration is called a “sloping” hearing loss.
#2. Notched Hearing Loss Audiogram

Sometimes, those with a noise exposure history will have a “notched” hearing loss configuration with a V pattern between 2000 - 4000 Hz with better hearing at the lower and higher frequencies.
#3. Reverse Slope Hearing Loss Audiogram

Some people have low-frequency hearing loss, which looks like a rising pattern on the audiogram. This audiogram is sometimes called a “reverse slope” hearing loss.
#4. Cookie Bite Audiogram

A mid-frequency hearing loss, or “cookie bite” configuration, is typically a genetic type of hearing loss. This type of hearing loss allows hearing at low and high frequencies, with most of the hearing loss occurring at the mid-frequencies.
#5. Unilateral Hearing Loss Audiogram

Some people have hearing loss in one ear and not the other. This is called unilateral hearing loss, where one ear hears normally and the other has hearing loss.
#6. Asymmetric Hearing Loss Audiogram
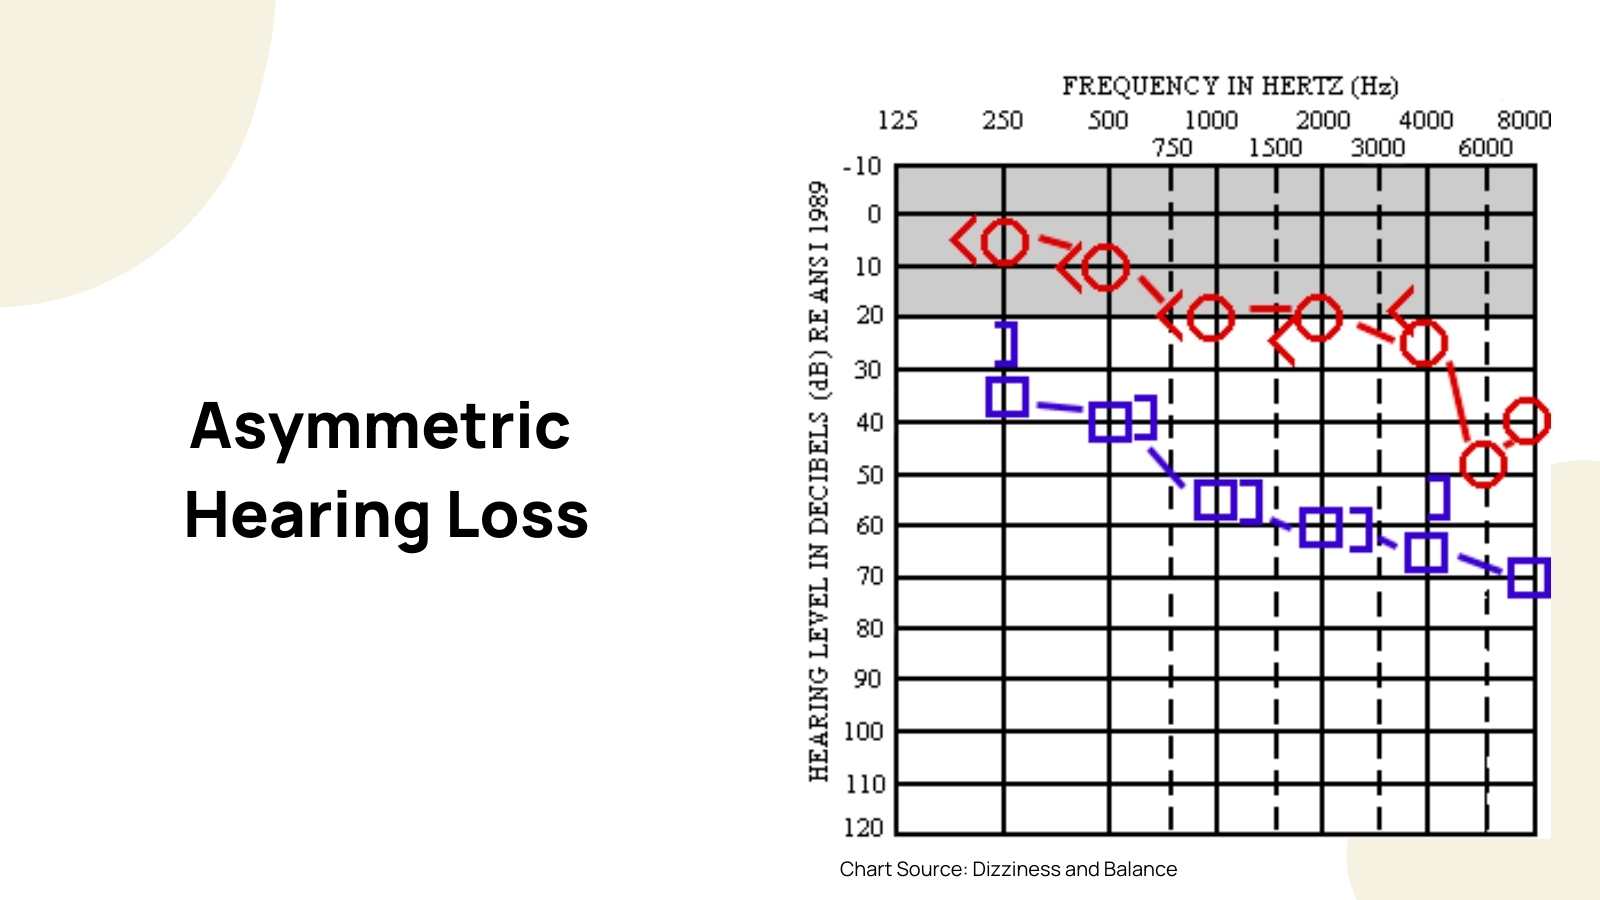
In some cases, both ears may have hearing loss, with one ear worse than the other. This is called asymmetric hearing loss.
Each person’s hearing is different, but an audiogram helps us chart the course and determine possible treatment options.
If you have never taken a hearing test, you can try our free hearing screener to see your own (simplified) audiogram results.

